


Medan, Indonesia. Universitas Sumatera Utara (USU) maintains water consumption records to support responsible resource management across its campus facilities. By quantifying water use, the university provides a basis for reviewing operational demand and planning conservation measures in support of Sustainable Development Goal 6 on clean water and sanitation.
Measuring Water Use Across Campus
The consumption figures reported for January to November 2025 total 549,059,525 litres, equivalent to 549,059.525 cubic metres. Across the eleven-month reporting period, this represents an average of approximately 49.91 million litres per month. The total covers January through November and excludes December.
These figures document the scale of water use during the reporting period. Maintaining records over defined intervals supports consistent reporting and gives the university a reference for examining consumption patterns, identifying areas requiring further review and informing water conservation priorities.
In its published account of water consumption tracking, Universitas Sumatera Utara describes the use of official water utility billing records for monthly and annual analysis. This establishes a documented approach to monitoring municipal water supply and retaining information that can be traced to its source.
Water Supplied Through the Municipal Network
USU’s 2025 Green Campus and UI GreenMetric Report identifies the regional water utility (PDAM) as the main supplier of clean water for university operations, including faculty buildings, laboratories, student dormitories, sports facilities, academic offices and other campus services. Its multi-year water-use register provides year-labelled totals and monthly averages for the recorded utility supply. The January–November 2025 figure refers to the documented reporting period and should not be presented as a full-year volume.
| Year | Coverage | Average monthly consumption (million litres) |
|---|---|---|
| 2020 | Jan–Dec | 53.97 |
| 2021 | Jan–Dec | 51.72 |
| 2022 | Jan–Sep | 65.62 |
| 2023 | Jan–Jul | 56.79 |
| 2024 | Jan–Aug | 69.94 |
| 2025 | Jan–Nov | 49.91 |
Source: USU Green Campus and UI GreenMetric Report 2025, Water (WR.4). Periods differ; values are monthly averages, not directly comparable annual totals.
Figure 1. Monthly averages from the periods specified in the institutional register; 2025 covers January–November only.
Water Sources and Scope of Measurement
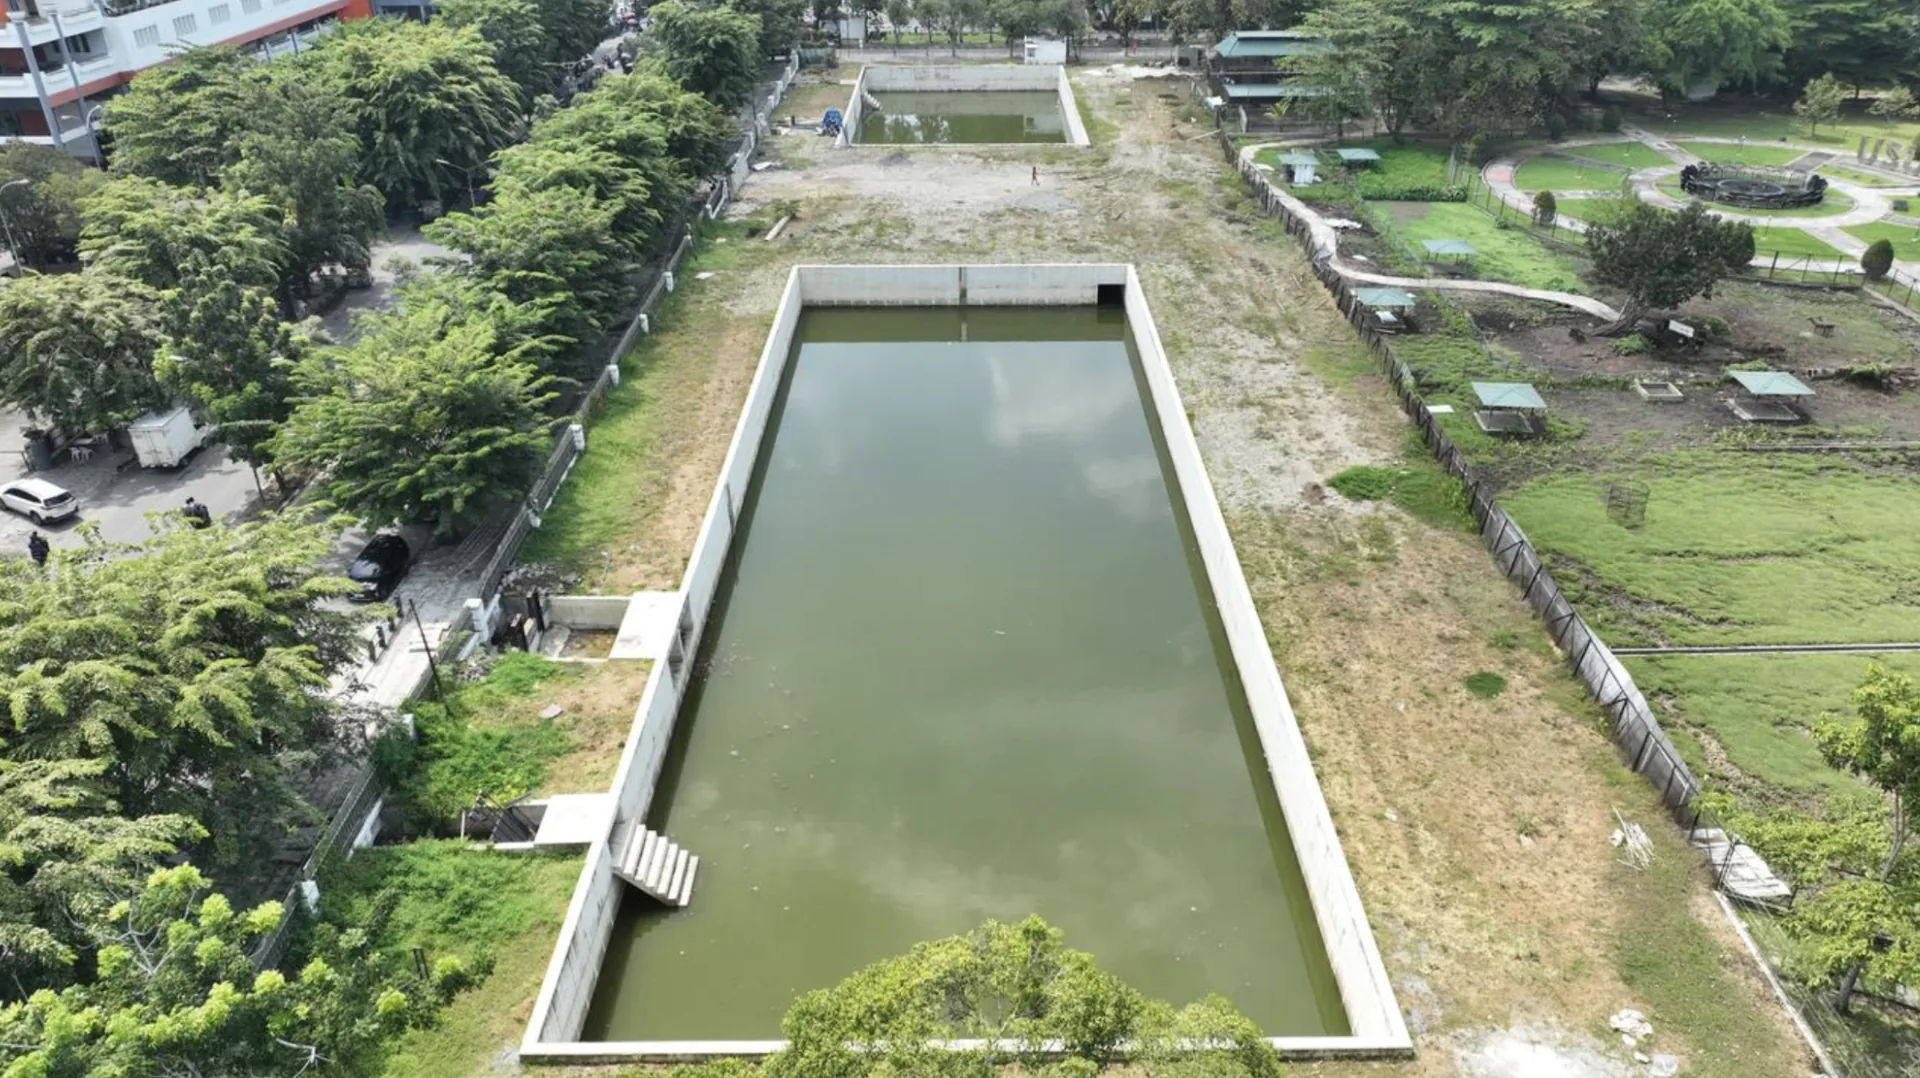
The recorded consumption is linked to mains water supplied through PDAM, the university’s principal documented source. The available 2025 report does not provide separate measured withdrawal totals for desalinated water or water extracted directly from rivers, lakes or aquifers. Consequently, the PDAM figure should not be described as an independently verified total across every possible water source. The university also documents rainwater harvesting and water recycling, which are additional water-management activities rather than evidence of withdrawals from those source categories.
Conservation and Efficient Water Use
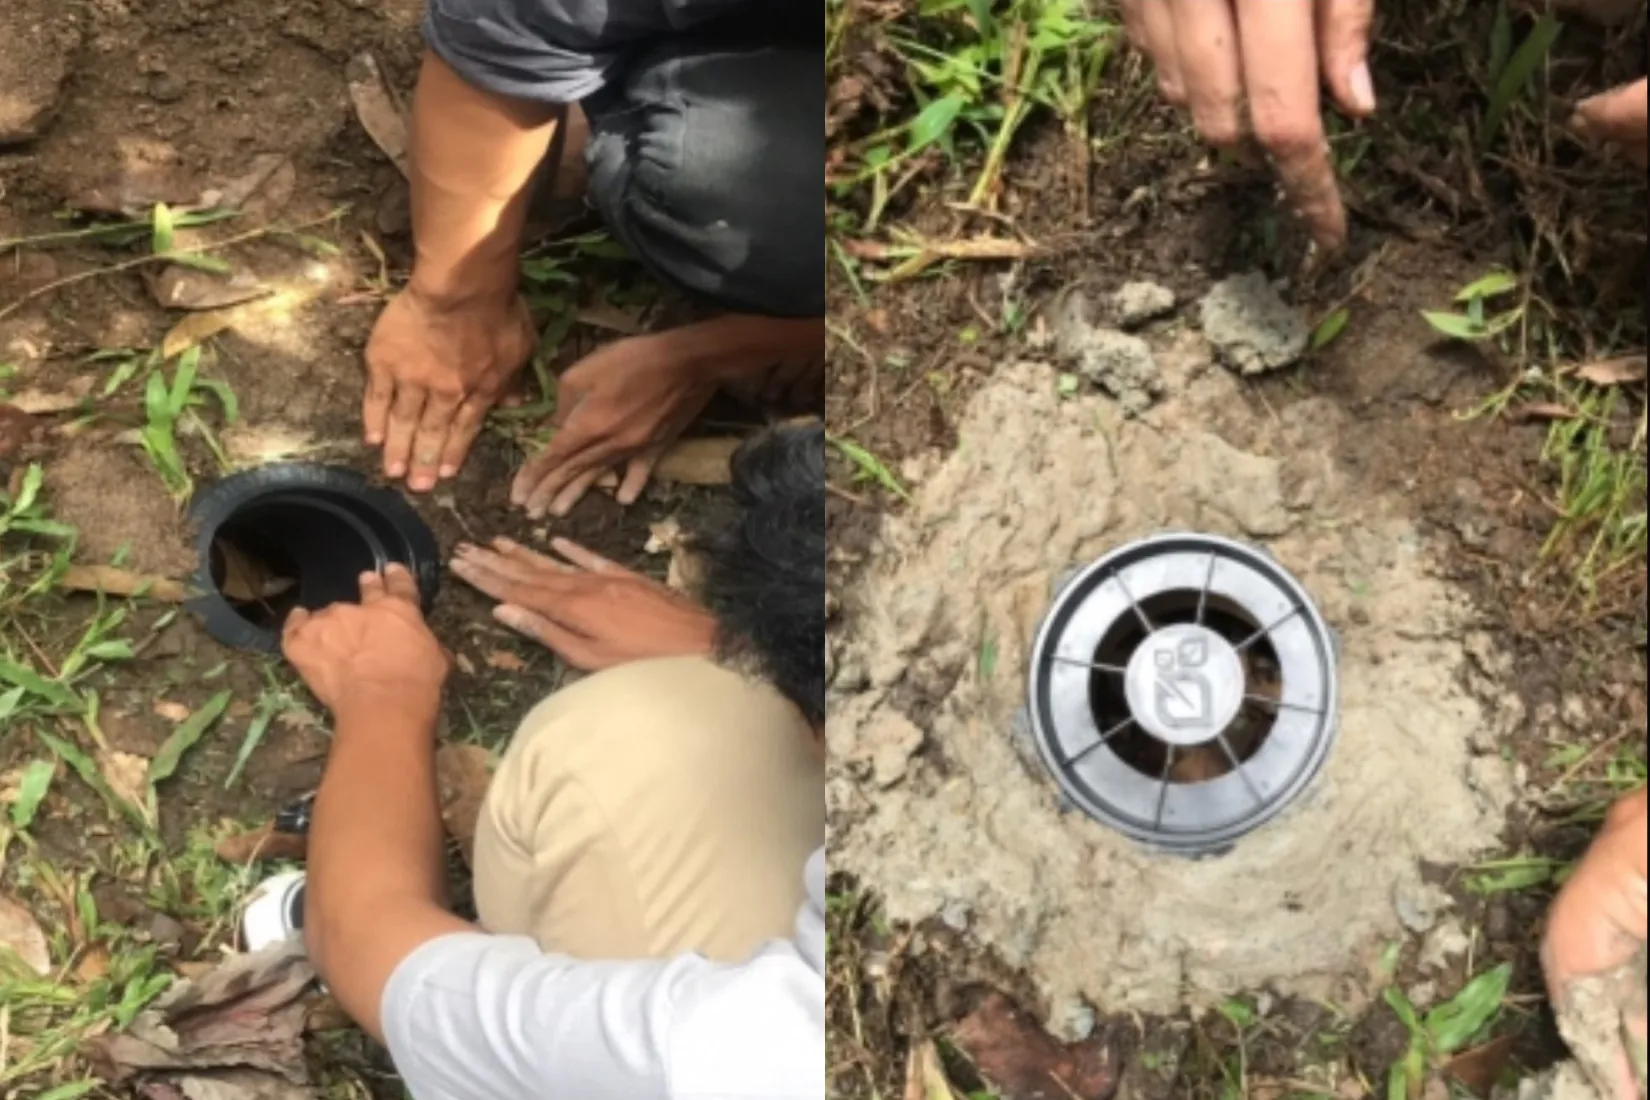
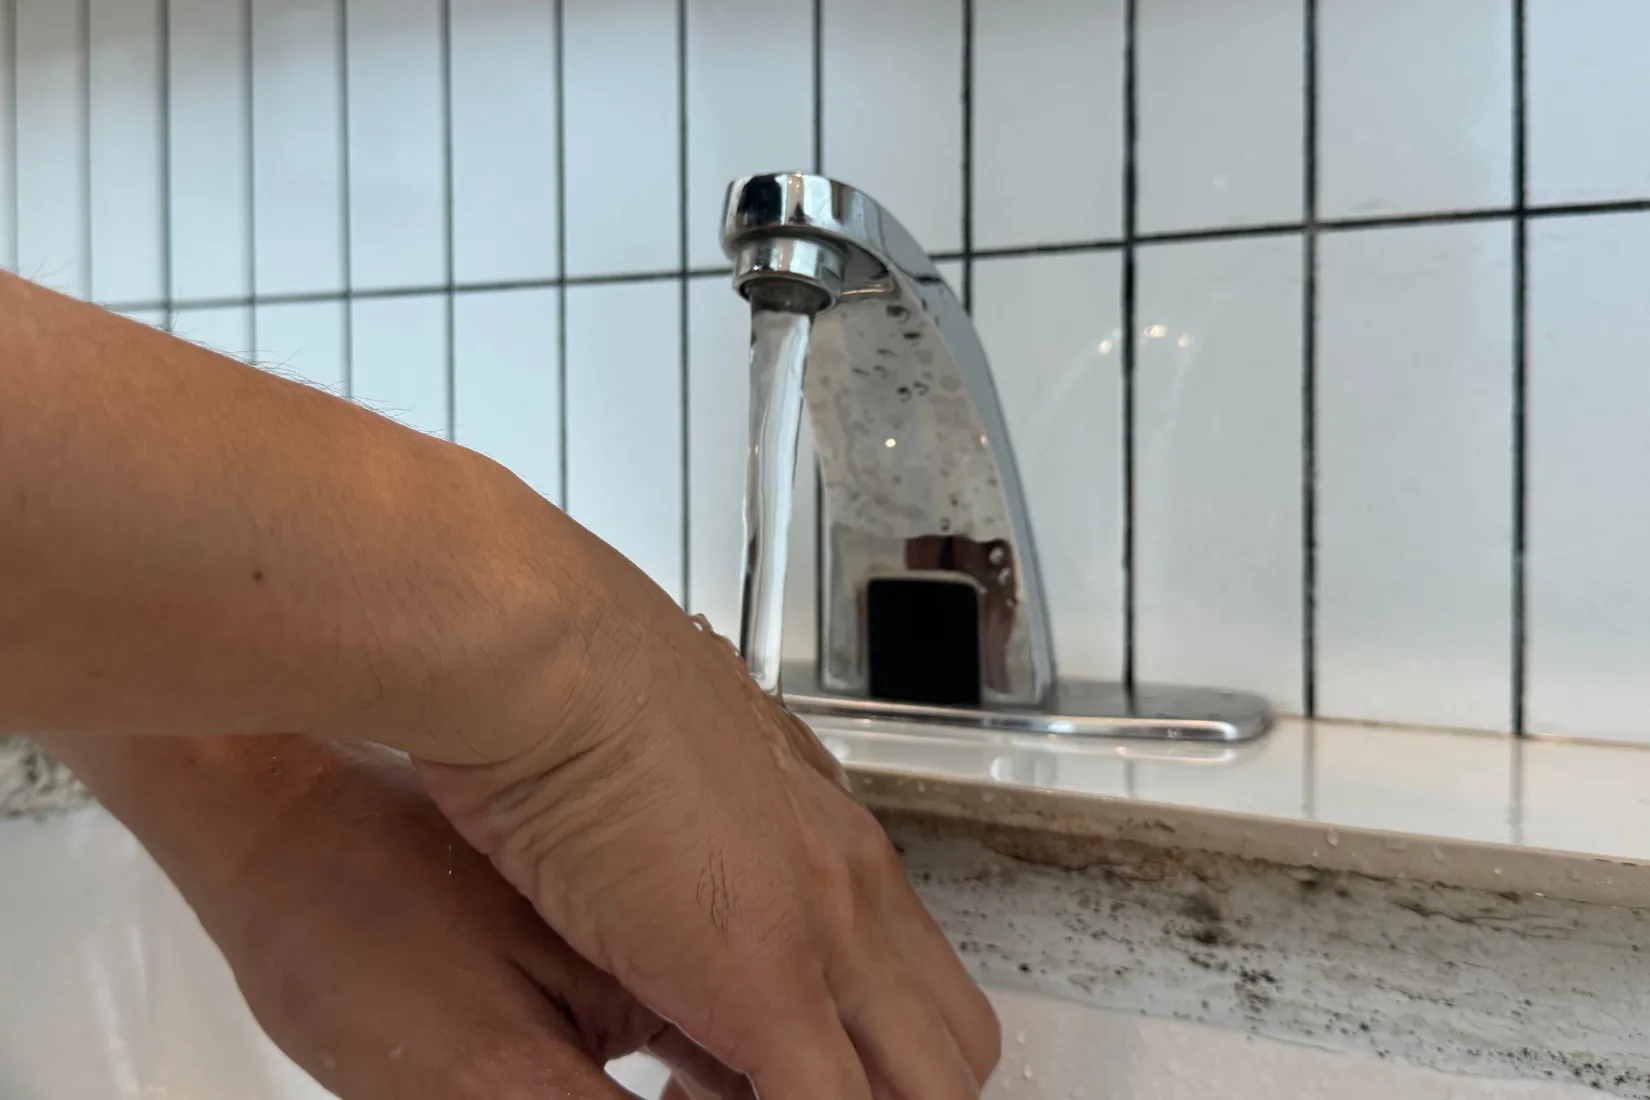
Monitoring forms part of a broader approach to water efficiency. The university’s report on water-efficient building design describes sensor-operated taps and low-flow toilets, alongside rainwater harvesting and wastewater reuse. These facilities are intended to limit unnecessary water use while supporting the daily needs of campus users.
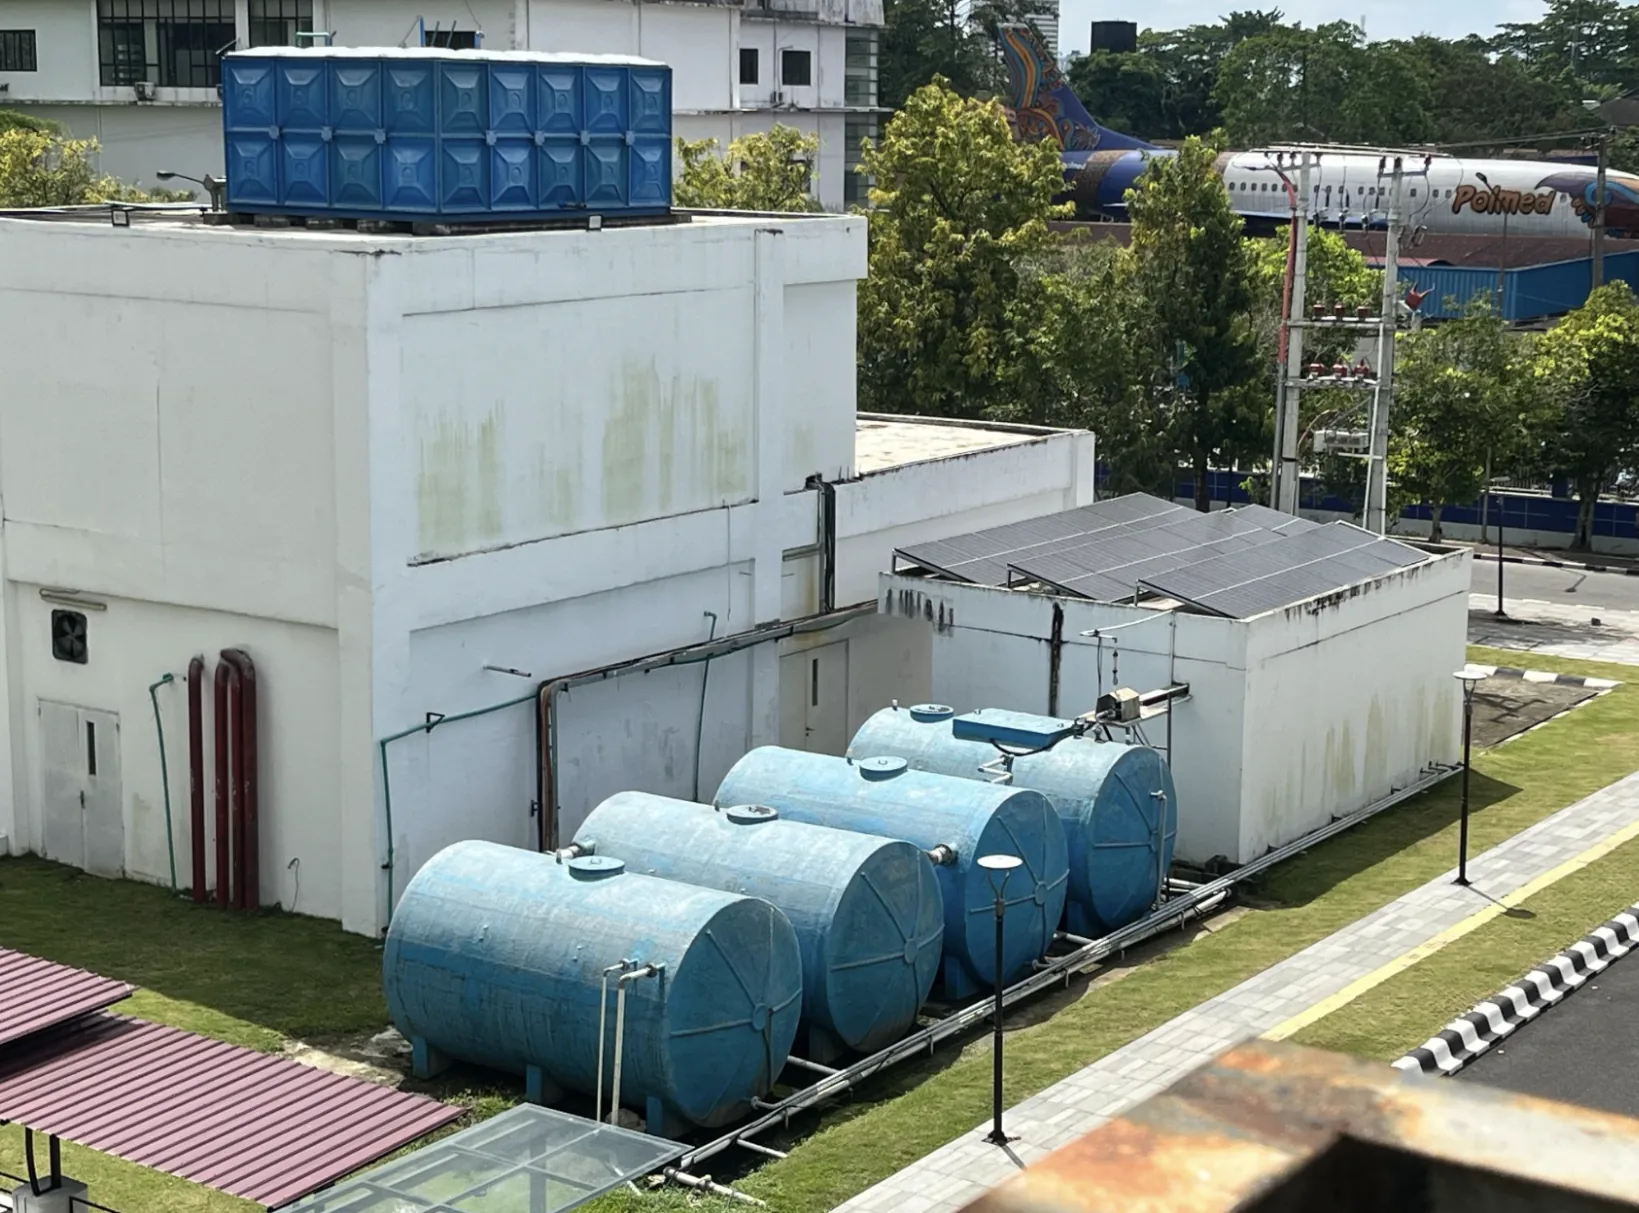
Consumption records provide a basis for evaluating such measures when comparable data are available. Assessing changes in efficiency requires consistent reporting periods and facility coverage, together with consideration of campus activity and water sources. The January–November total therefore provides a documented volume for assessment, while any quantified savings require a comparable baseline.
The 2025 average of 49.91 million litres per month was lower than the 69.94 million litres reported per month for January–August 2024. Because the periods differ, this comparison describes the recorded monthly averages rather than a confirmed like-for-like annual saving. The university’s reporting also documents sensor-operated faucets, water-efficient flushing equipment and reuse of treated wastewater for appropriate non-potable purposes.
Supporting Sustainable Water Management
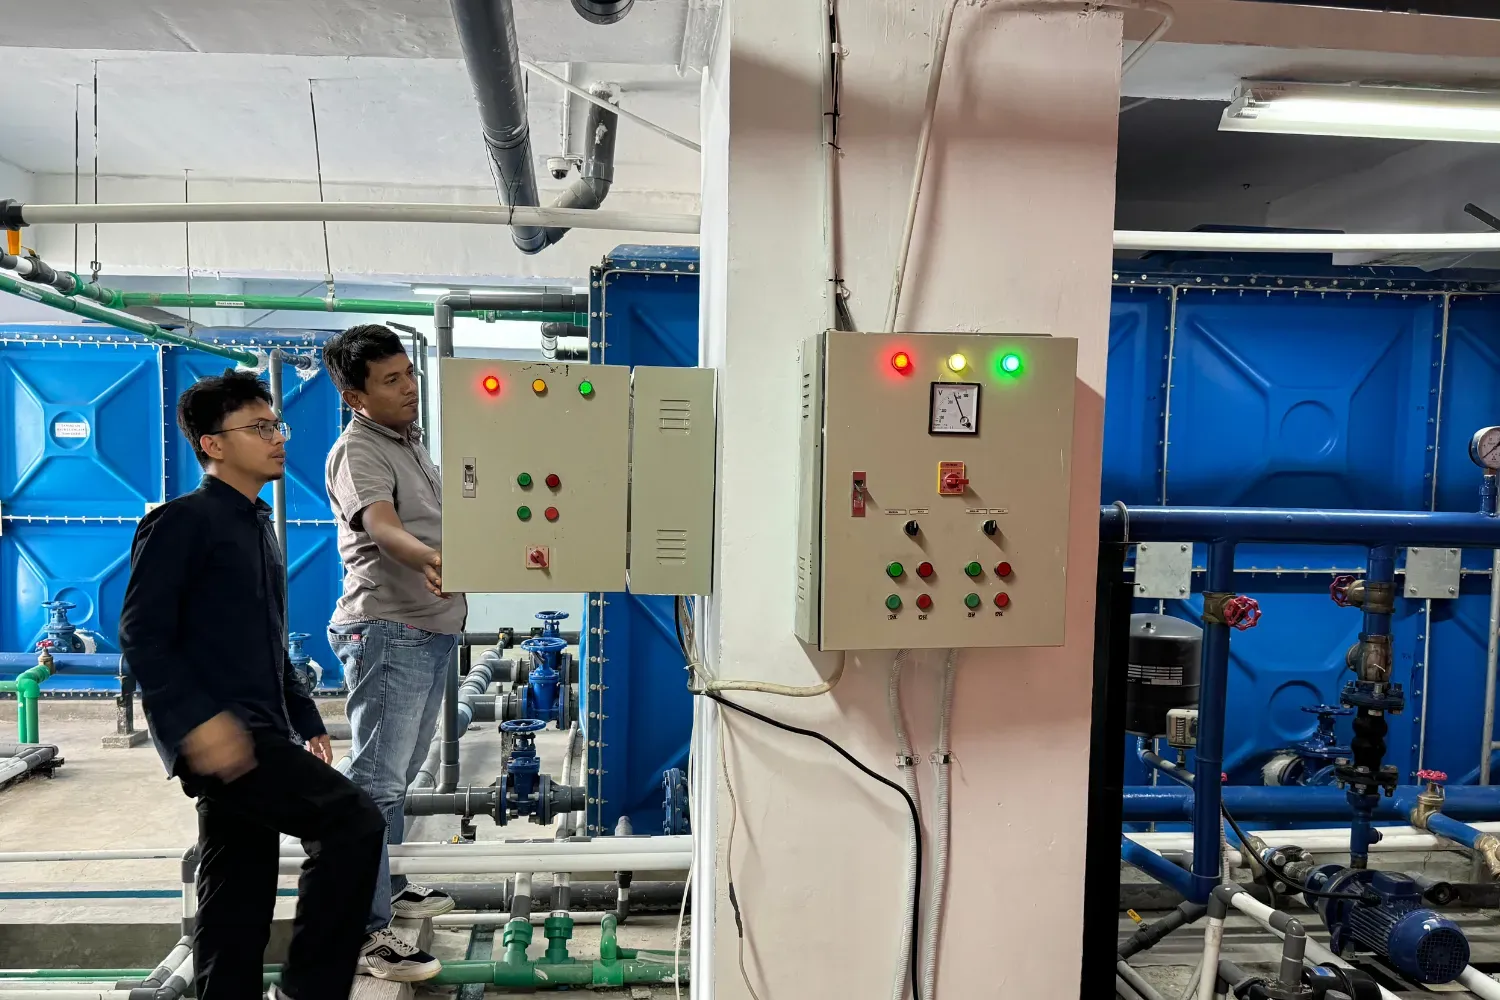
The combination of consumption monitoring and water-saving infrastructure supports the direction of SDG Target 6.4, which addresses improved water-use efficiency and sustainable freshwater withdrawals and supply. Through continued measurement and reporting, Universitas Sumatera Utara strengthens the information available for water management decisions and institutional accountability.